The space requirement behind the rent.
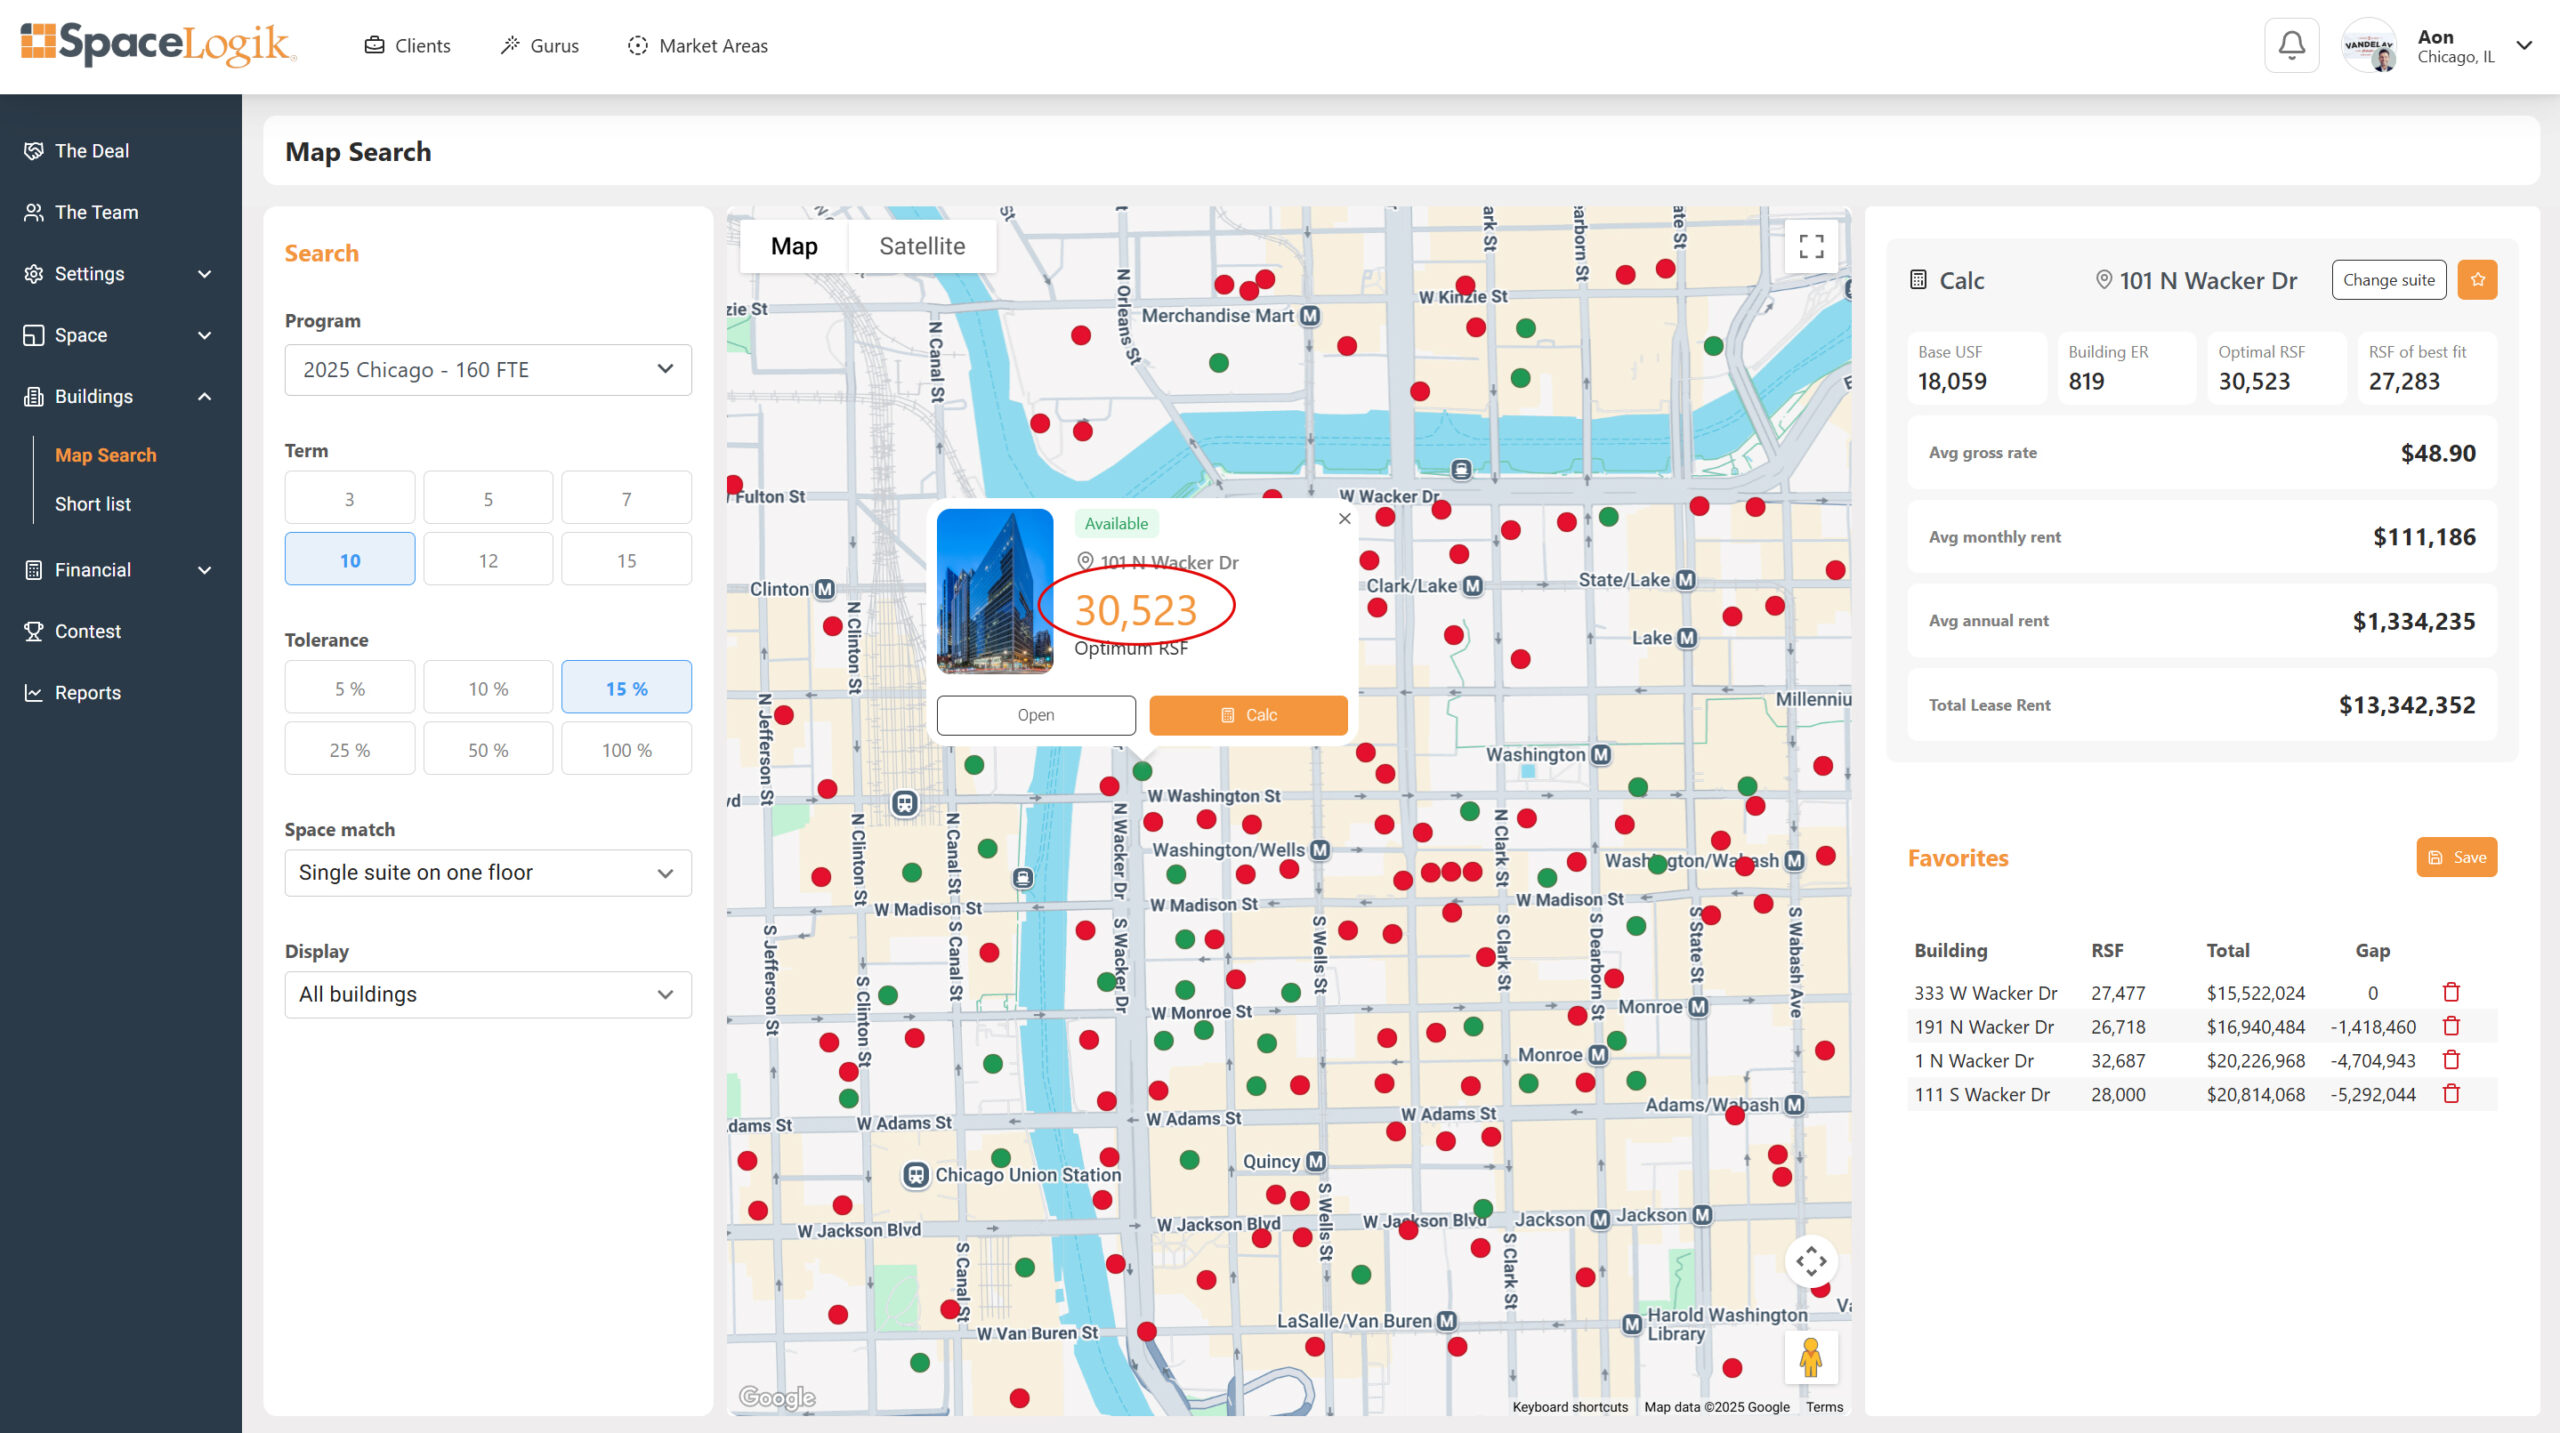
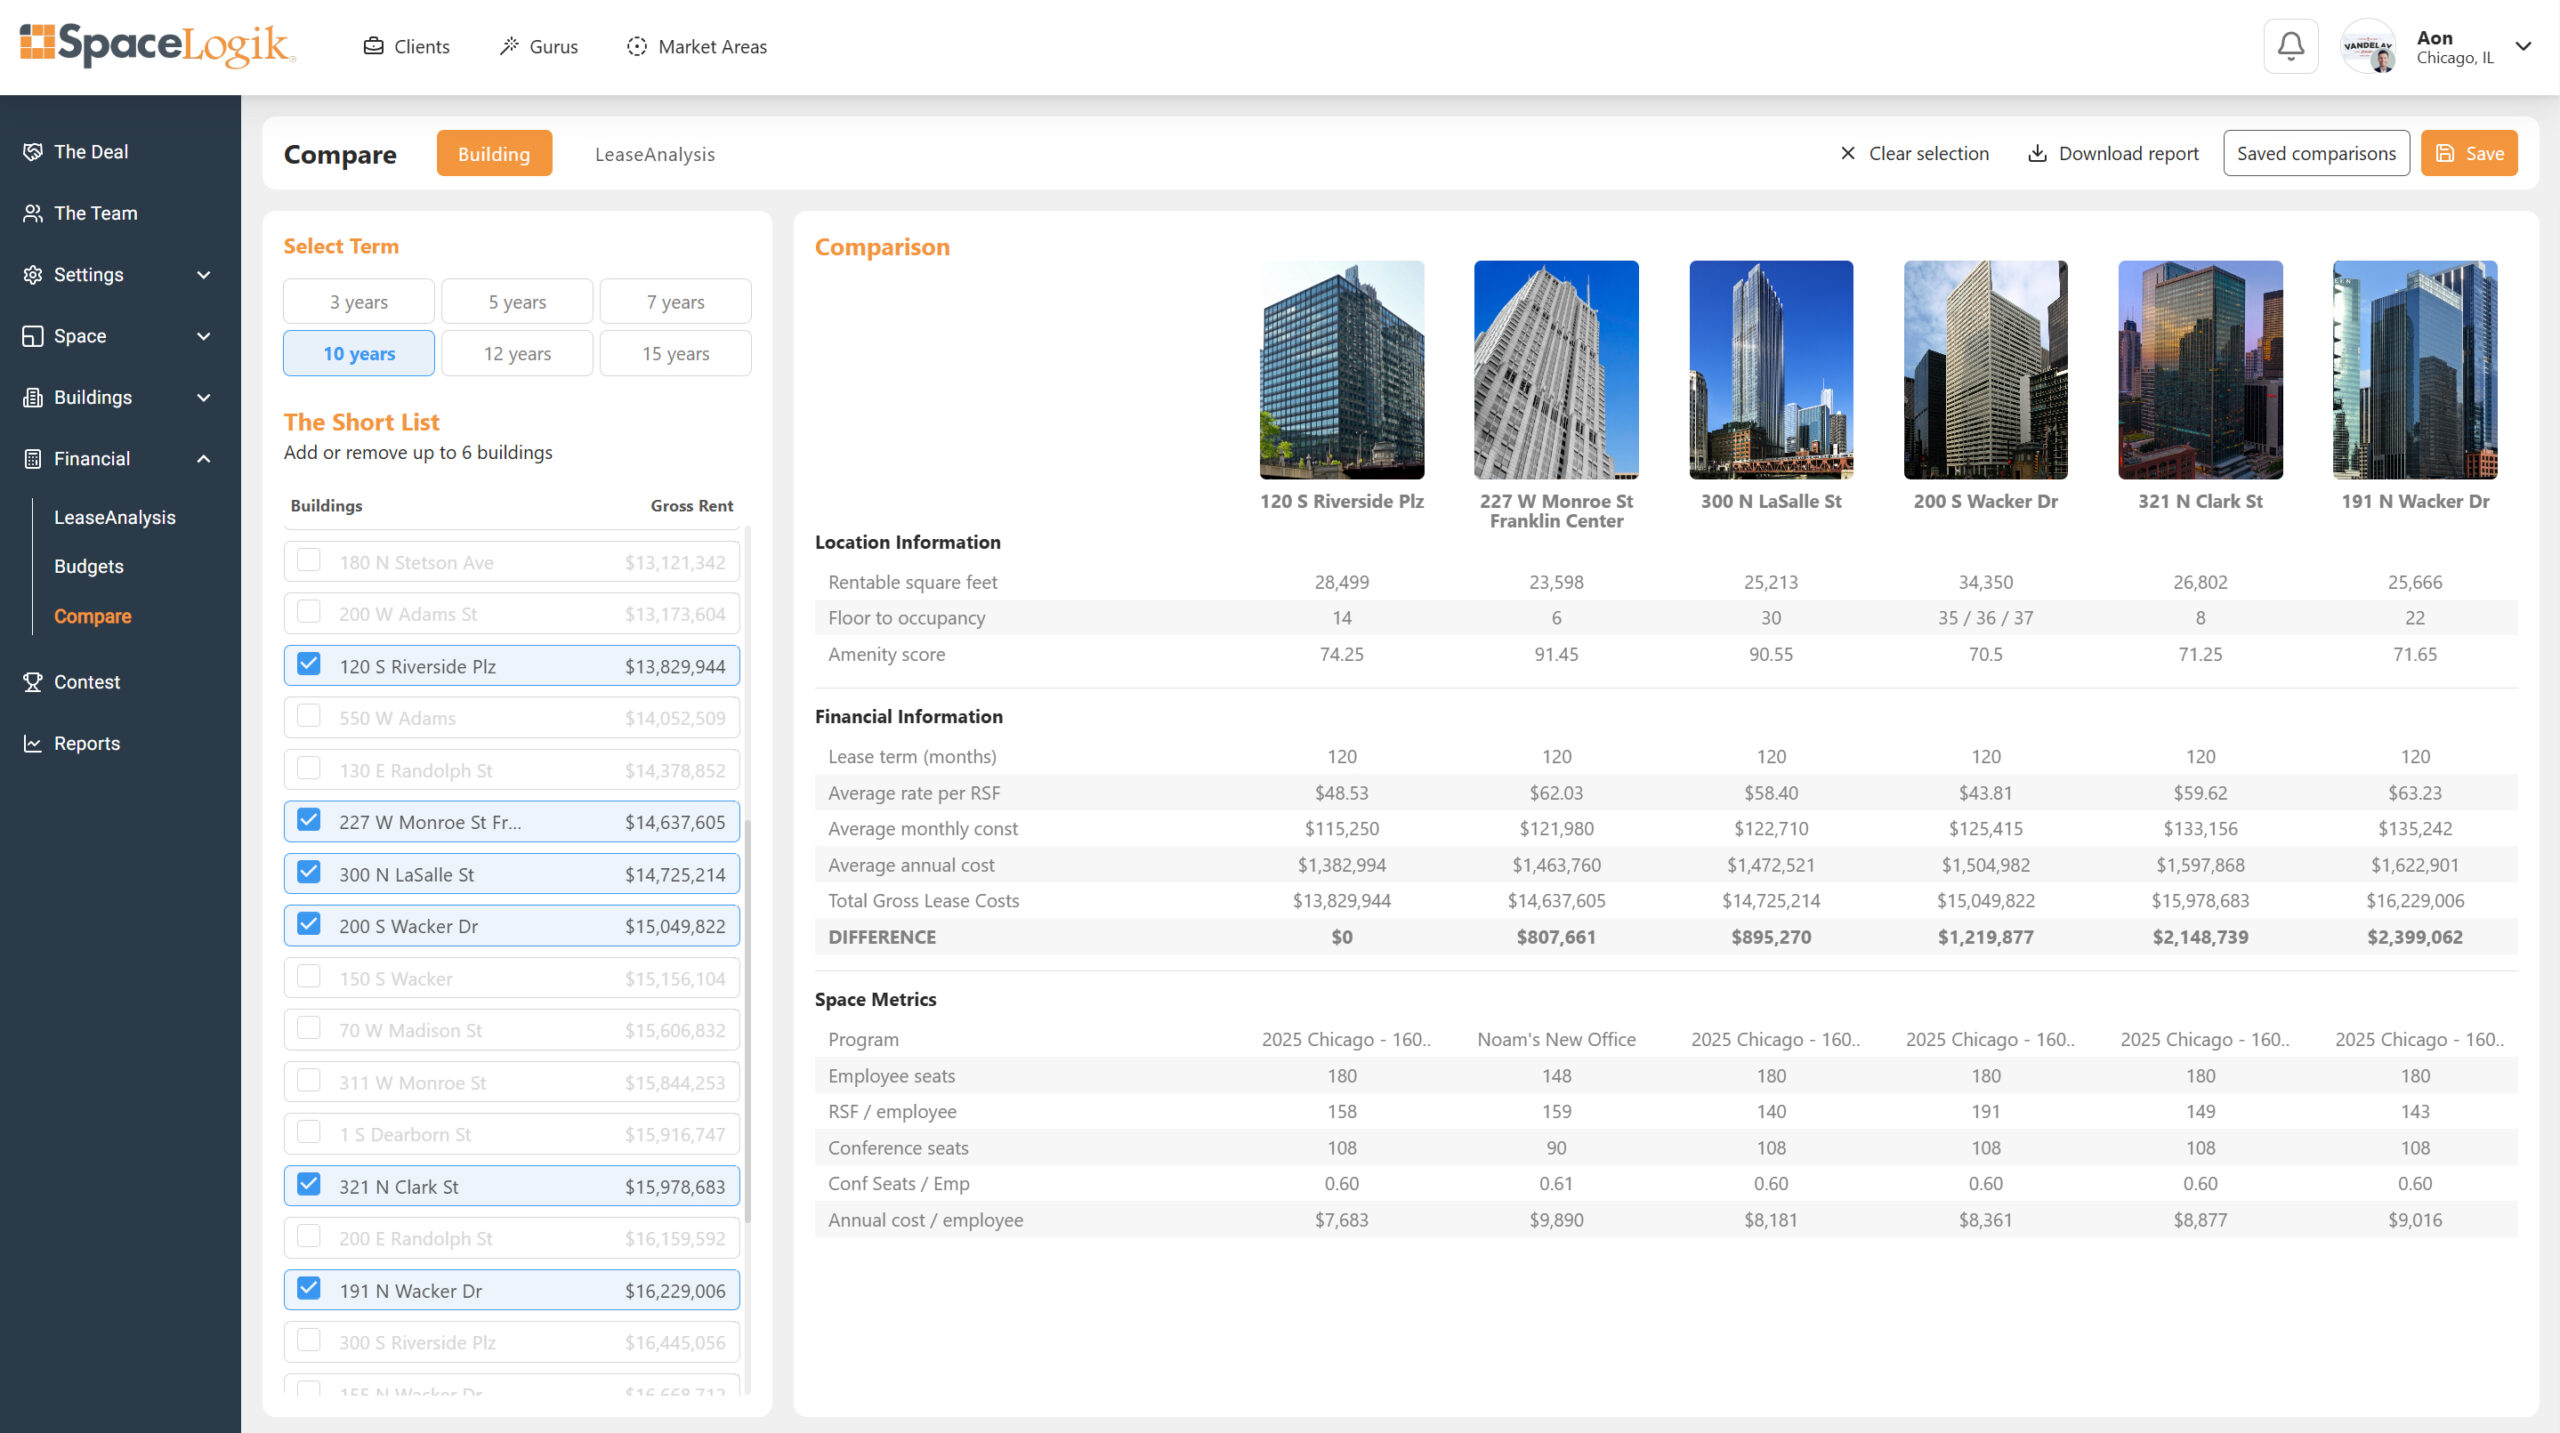
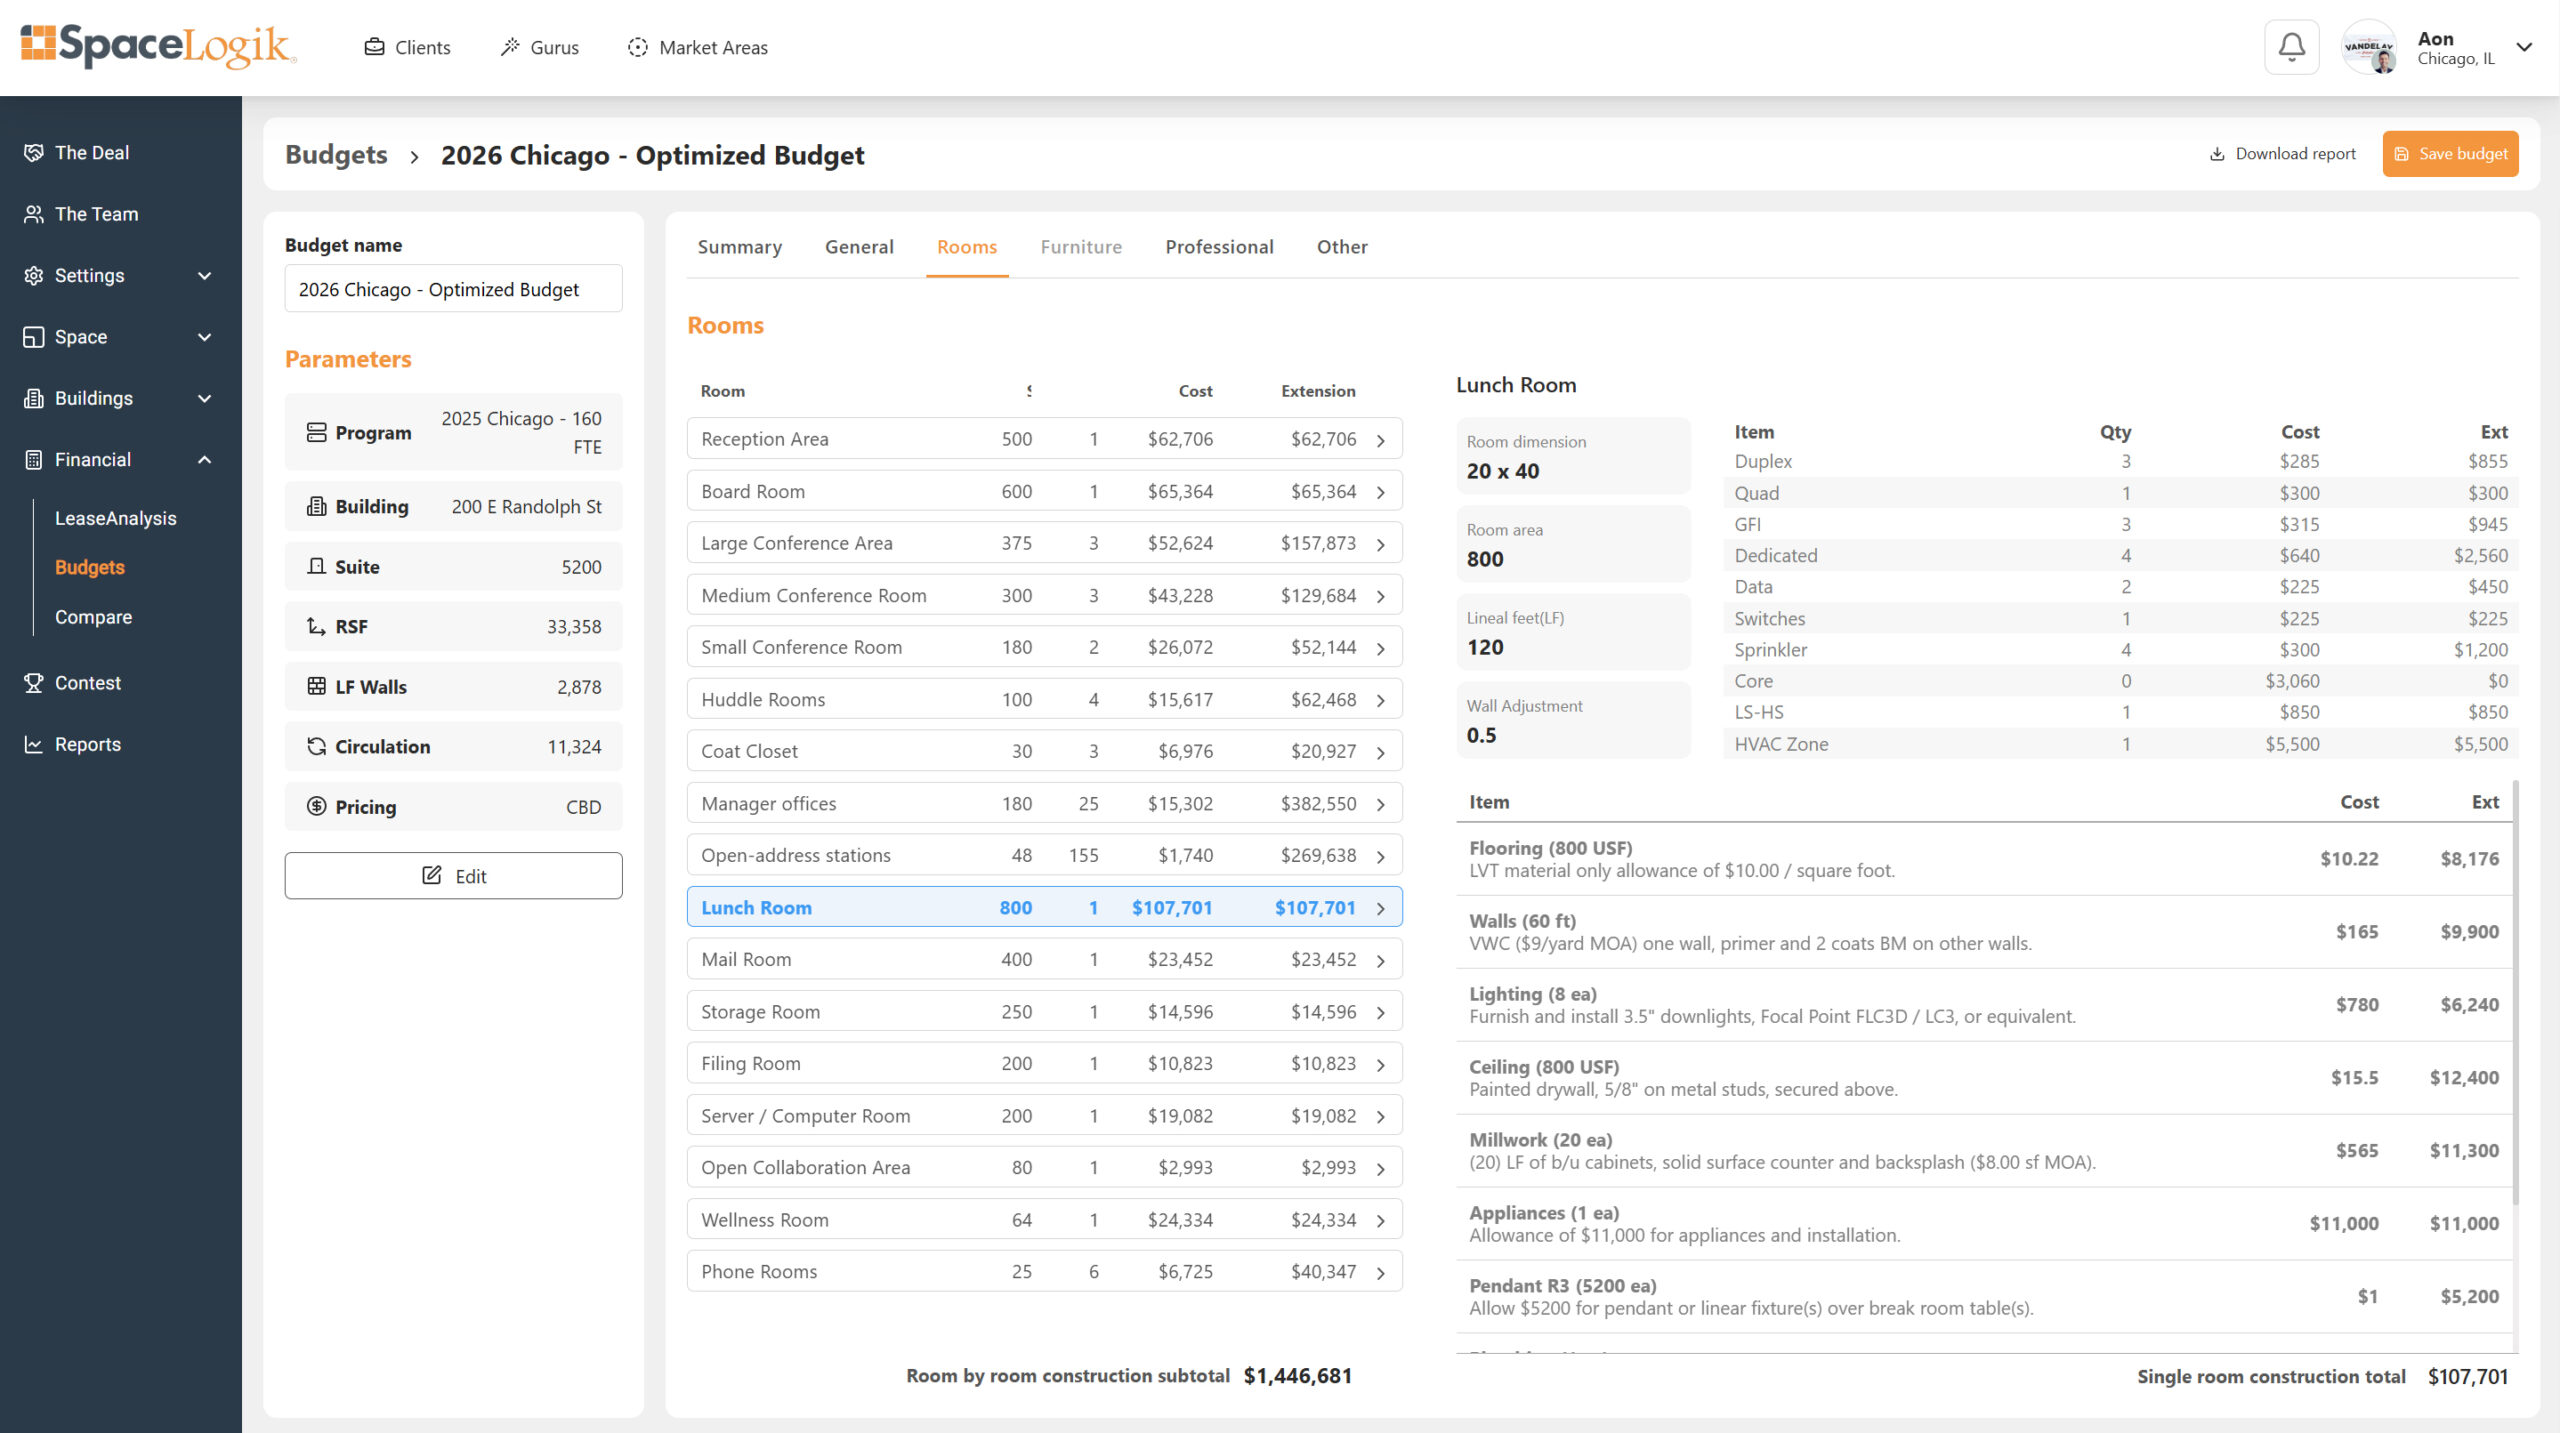
A property comparison should account for the amount of rentable space needed to accommodate your workplace program. The projected requirement at 225 W. Wacker Drive gives you another measure to consider alongside the quoted rent.
| Series measure | Reported figure |
|---|---|
| Downtown Chicago ranking | #1 |
| Series comparison program | 20,000-RSF reference |
| Projected building requirement | 16,258 RSF |
| SpaceLogik efficiency rating | 910 |
| Savings versus least-efficient properties | 18.2% |
| Illustrative annual rent assumption | $60 per RSF |
| Reported rent savings | $10.92 per RSF/year |
Source figures retained from SpaceLogik’s supplied Chicago 2026 deck. Rent savings use the series comparison basis; they are not a quoted discount on this building’s asking rent. The $60 rent is an illustrative assumption.
Compare this building for your own workplace.
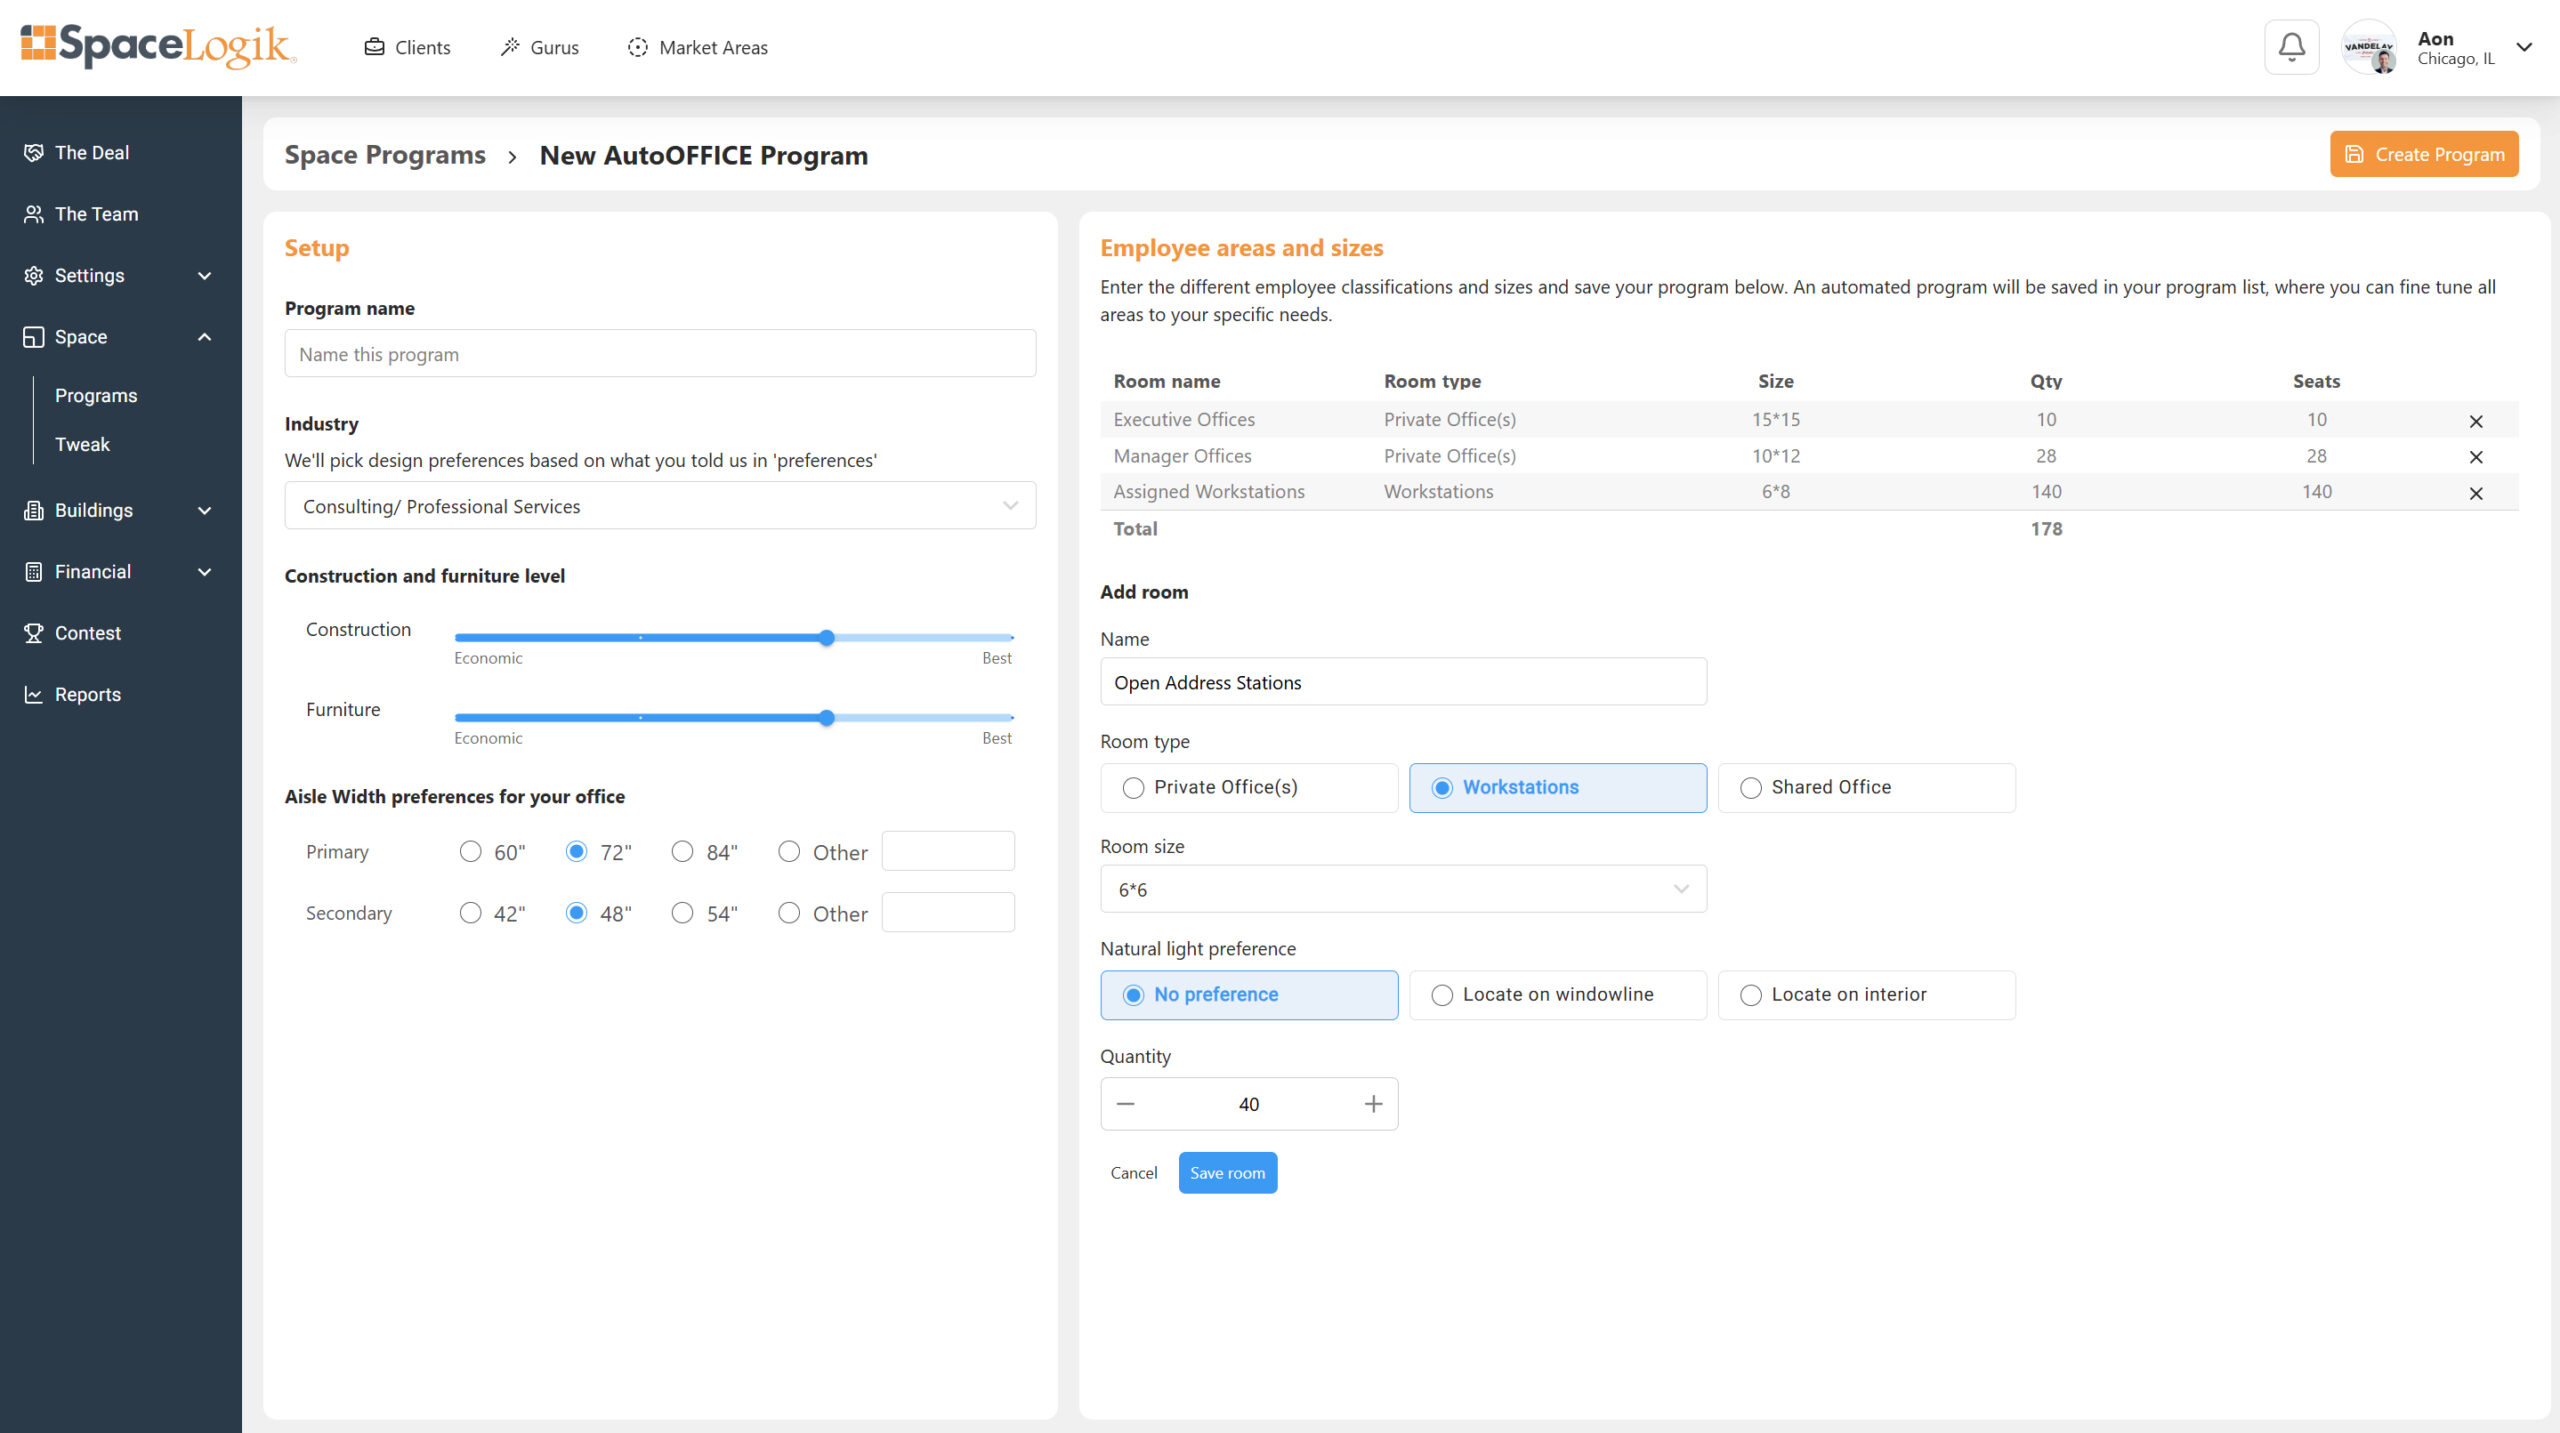
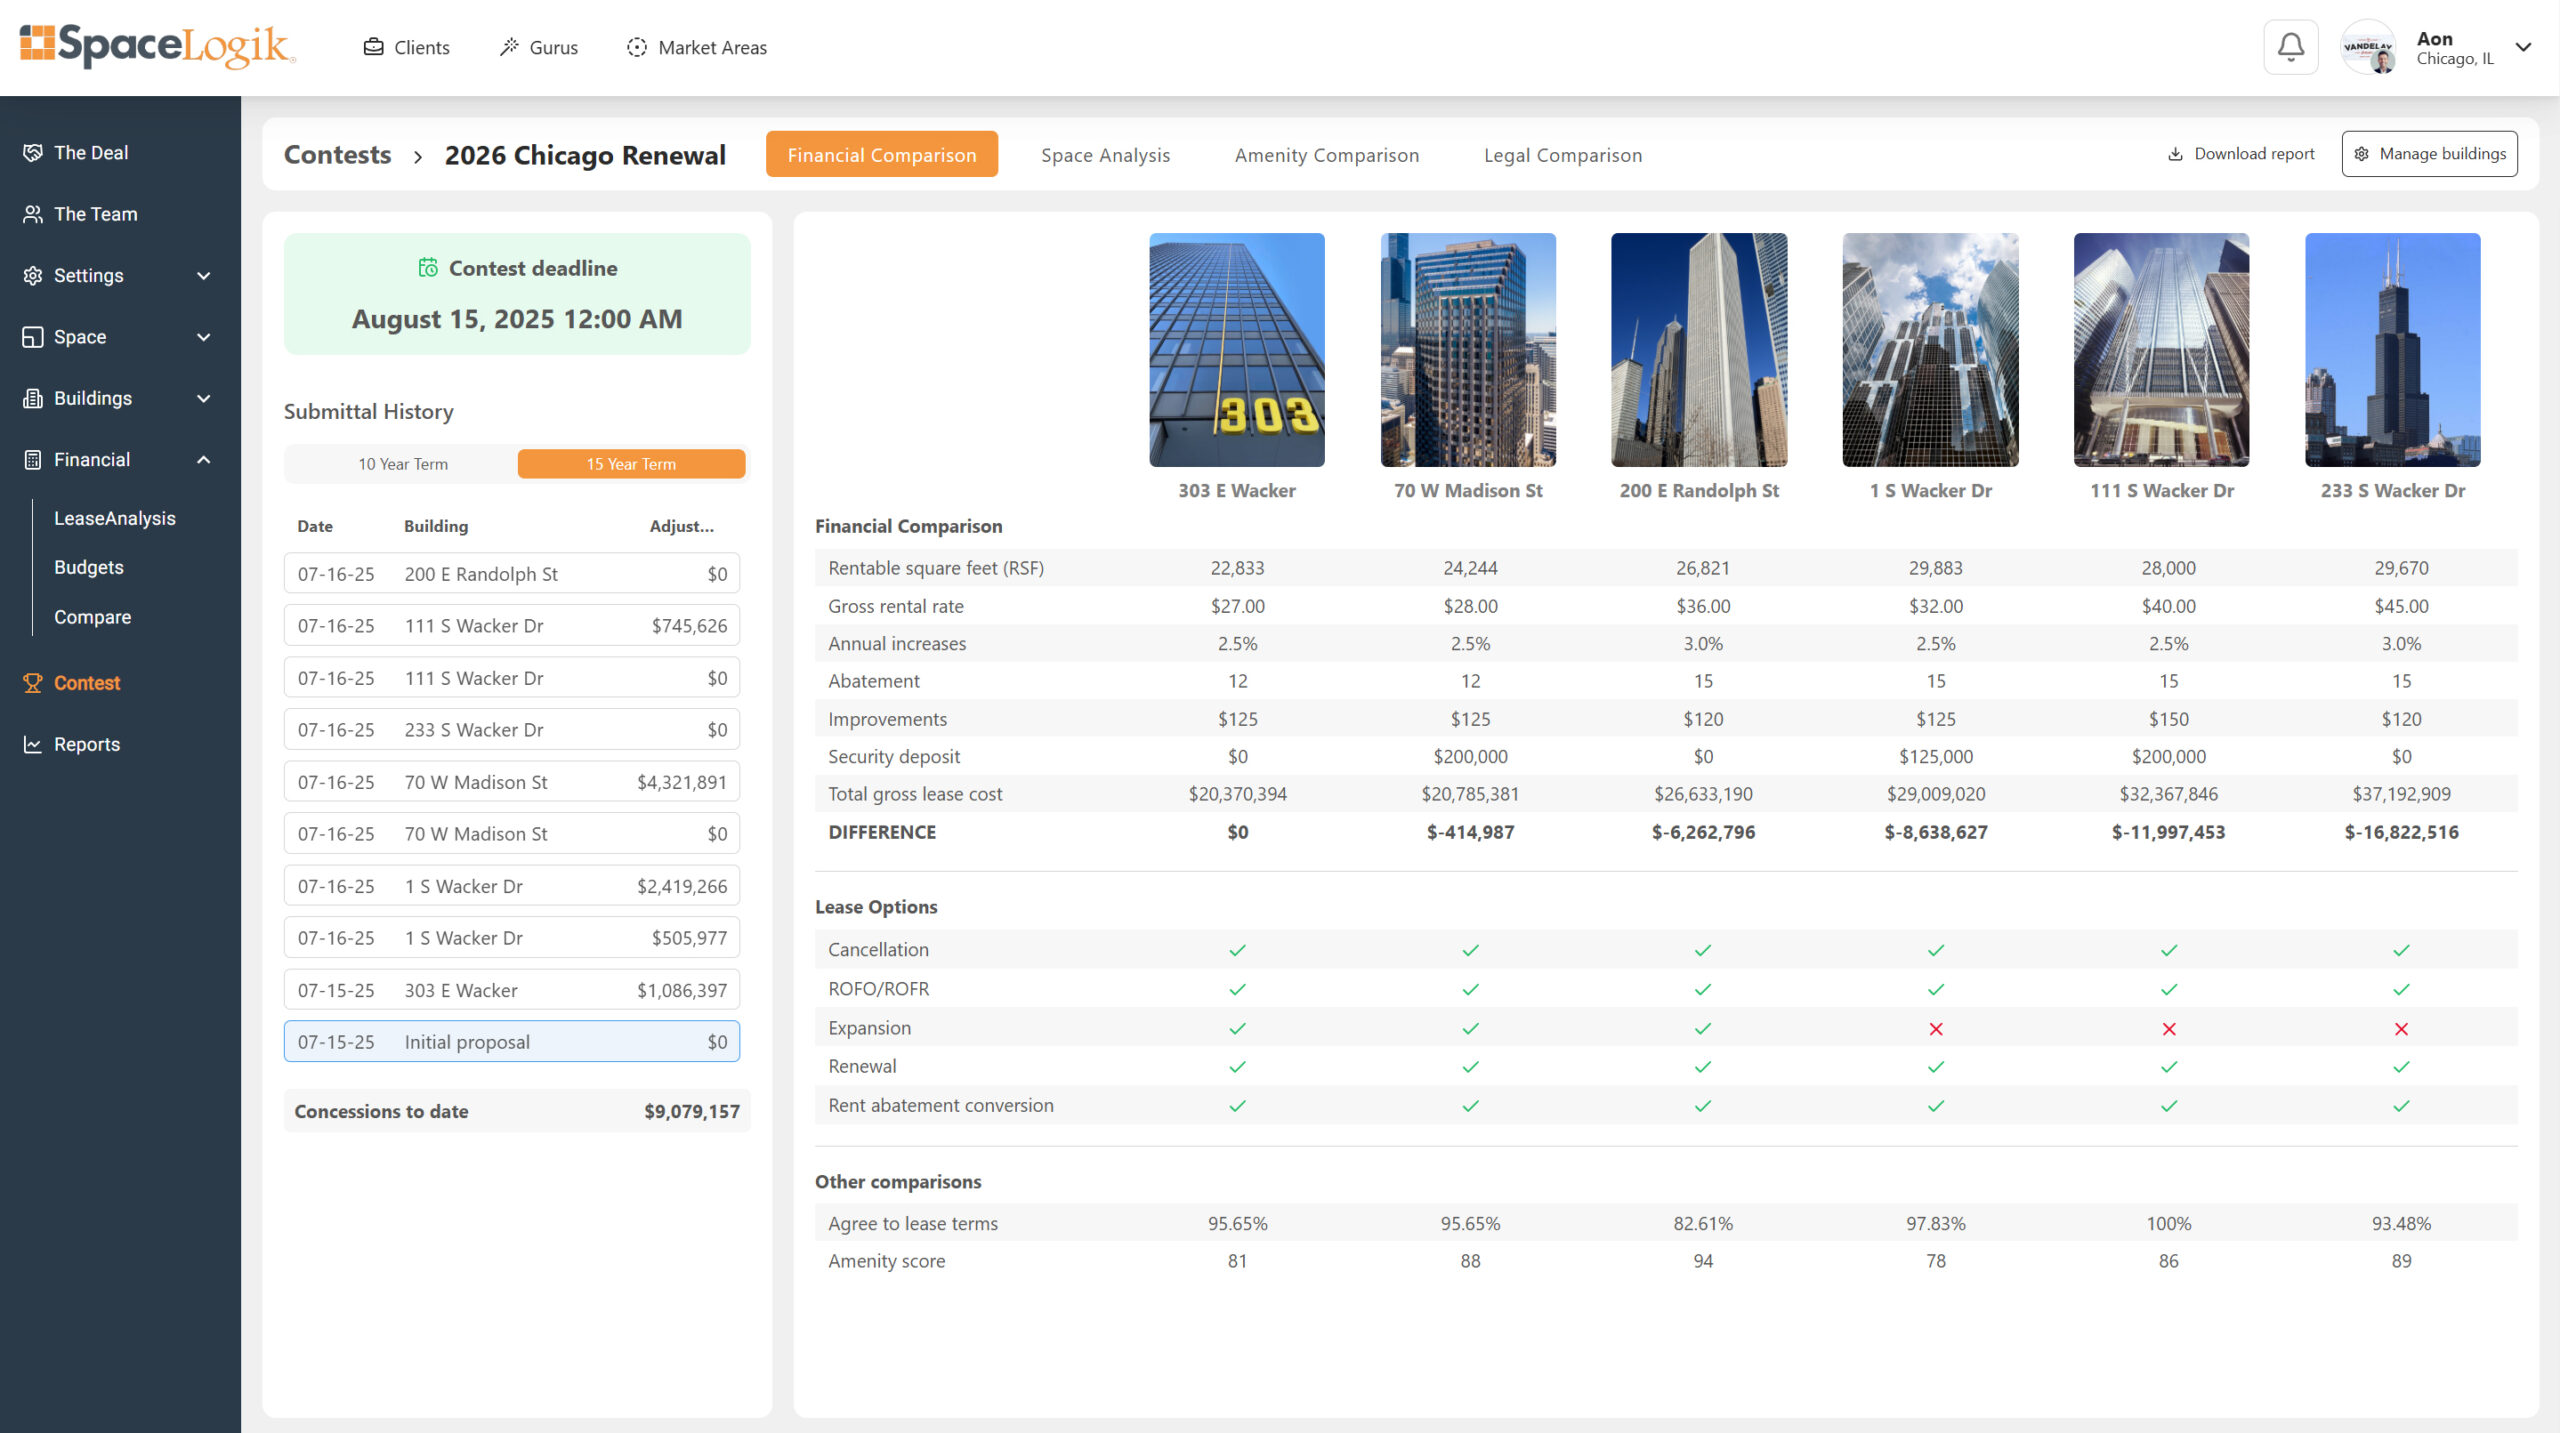
Your organization’s requirements determine the space you need. Use SpaceLogik’s patented space optimization tools to evaluate 225 W. Wacker Drive alongside other buildings using your own program, then compare total lease costs.
About this analysis
This spotlight belongs to SpaceLogik’s downtown Chicago 2026 series. Rankings and metrics describe the supplied analysis. Actual requirements and savings depend on your program, building and lease terms. Space efficiency concerns office space requirements and is separate from energy performance.
View the SpaceLogik LinkedIn post
Draft review notes — excluded from publication
The deck lists 16,258 RSF, which implies 18.71% against 20,000 RSF, while the reported savings are 18.2%. Confirm the projected RSF and comparison baseline. All figures are preserved from the deck rather than silently corrected. Confirm the series methodology before publication.