A building’s efficiency changes the math.
Two buildings can accommodate the same workplace requirements while requiring different amounts of rentable space. Comparing rent per square foot alone can miss that difference.
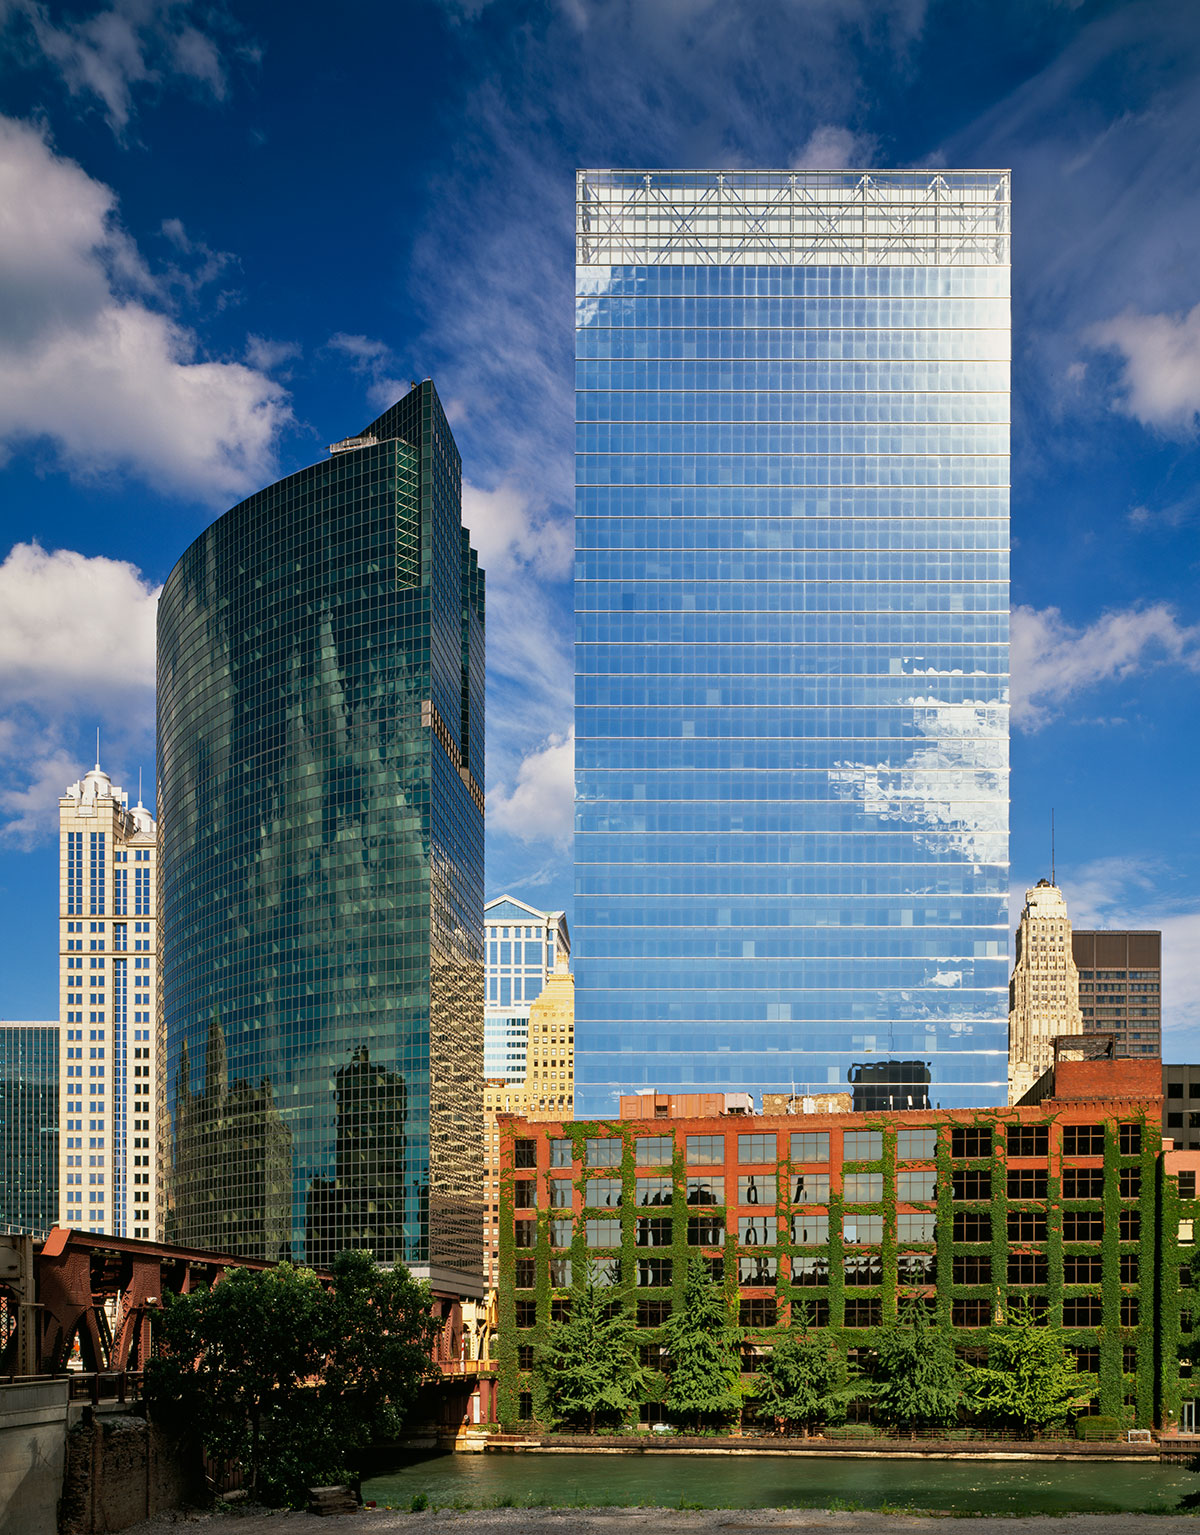
In this series, 191 N. Wacker Drive ranks #10 among SpaceLogik’s ten most space-efficient downtown Chicago office buildings. Its projected space requirement illustrates why building efficiency belongs in your property comparison.
| Comparison | Result |
|---|---|
| Comparison baseline | 20,000 RSF |
| Projected requirement at 191 N. Wacker | 17,960 RSF |
| Space reduction | 2,040 RSF / 10.2% |
| Assumed annual rent in both buildings | $60 per RSF |
| Baseline annual rent | $1,200,000 |
| Projected annual rent at 191 N. Wacker | $1,077,600 |
| Illustrative annual difference | $122,400 |
Equivalent to $6.12 in annual savings per baseline square foot. The $60 rent is a comparison assumption, not an advertised asking rent or a current lease quote.
What this means for your next lease.
Evaluate how much space your organization needs in each building, then compare the total cost of meeting those requirements. SpaceLogik’s patented space optimization tools help you make that comparison using your own workplace program.
About this comparison
Figures and ranking come from SpaceLogik’s Chicago 2026 downtown building efficiency series. This example uses a 20,000-RSF baseline and an equal annual rent assumption of $60/RSF to isolate the space difference. Actual requirements and savings depend on your program and lease terms. Space efficiency concerns office space requirements; it is a separate measure from energy performance.
Preview review notes — excluded from publication
Confirm the original comparison program, the buildings evaluated, the meaning of the least-efficient comparison baseline, and the analysis date before publication. The projected RSF, rating, rank and percentage are retained from slide 1. Annual totals are calculated from those figures. Other building spotlights remain preview placeholders until their figures are reconciled.


